USDA FoodData Central Density Standards for Cooking & Baking Ingredients
"Learn how USDA FoodData Central supports ingredient measurement research, household weights, food density, and more reliable cups-to-grams baking conversions."
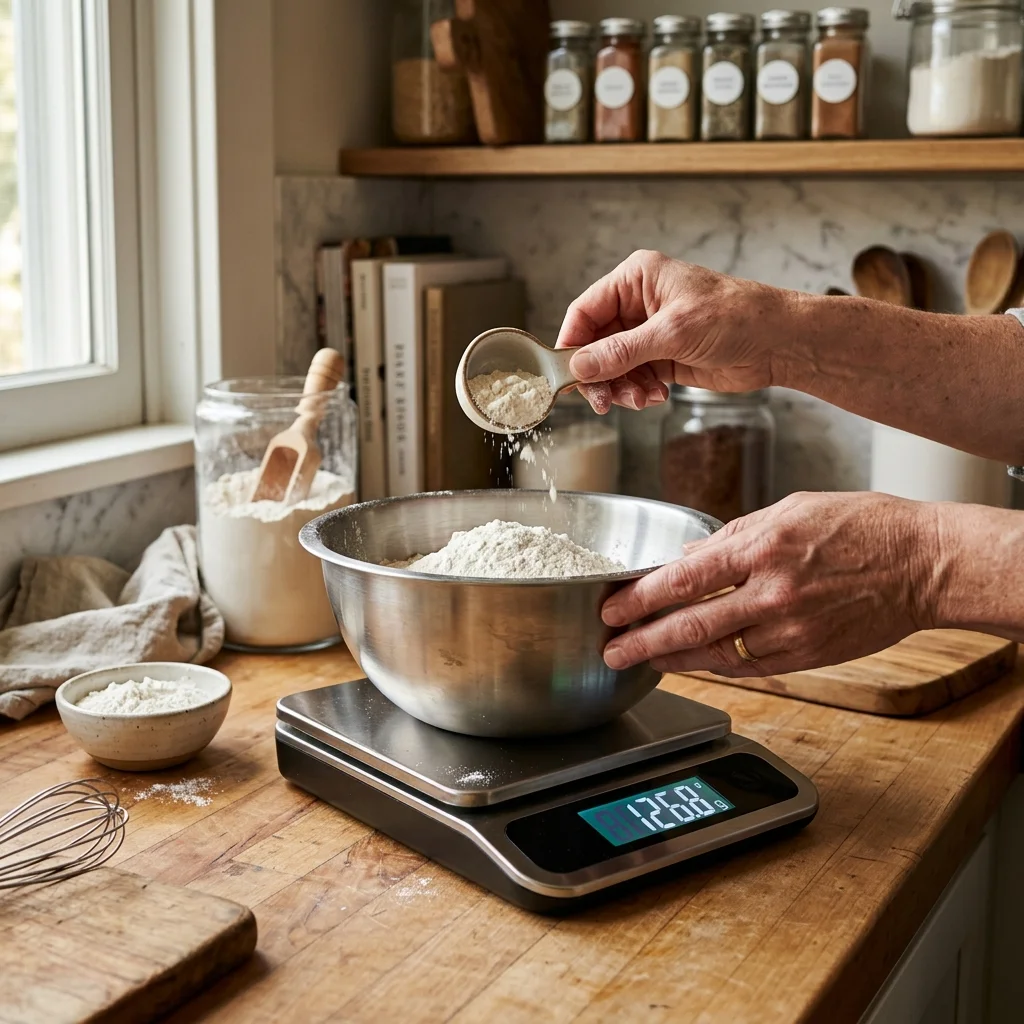
When bakers and recipe developers transition from volumetric cup measurements to gram-based weight precision, they frequently encounter USDA FoodData Central density standards and food composition databases. Managed by the USDA Agricultural Research Service, FoodData Central is the national baseline repository for food composition and nutritional analysis. However, a major point of confusion exists among home cooks and professionals alike: FoodData Central is a food composition database containing recorded household measures and laboratory sample weights, not a single universal "density mandate" or recipe instruction manual.
Understanding how to interpret USDA ingredient data, calculated mass-to-volume ratios, and portion weights requires recognizing the critical distinctions between food composition research, standardized household measures, calculated physical density, and real-world kitchen variables. In this comprehensive guide, we analyze how FoodData Central structures ingredient data, explain why database values may differ from baking weight charts, and provide a clear methodology for leveraging public food data without creating false precision.
Explore complete USDA density benchmarks across all 540+ items in our Density Database, explore the Flour Conversions Silo Hub, look up Softened Butter Density, or calculate baker's ratios via the Baker's Percentage Calculator.
What Is USDA FoodData Central?
USDA FoodData Central is an integrated data system created and maintained by the United States Department of Agriculture. Its principal mandate is to provide comprehensive, transparent, and scientifically validated food composition data for researchers, policy makers, health professionals, and the food industry.
Unlike commercial recipe apps or informal conversion tables, FoodData Central stores granular scientific data detailing macro- and micronutrient profiles, moisture content, sample collection methods, and associated portion weights. The database serves several distinct purposes:
- Nutritional Surveillance: Tracking national dietary intake and public health trends through standardized food records.
- Food Composition Analysis: Measuring total lipids, proteins, carbohydrates, ash, water content, and micronutrients across thousands of raw and processed foods.
- Portion & Weight Records: Associating common volumetric portions (such as 1 cup, 1 tablespoon, or 1 fluid ounce) with verified laboratory gram weights.
- Analytical Transparency: Documenting exact sampling locations, laboratory methods, and statistical variability across food items.
Does FoodData Central Provide Ingredient Weights?
Yes, but with an important structural caveat. FoodData Central does not publish a standalone "baking conversion chart." Instead, individual food records in the database contain a Portions and Measures section. In this section, food scientists assign specific gram weights to standardized household measures.
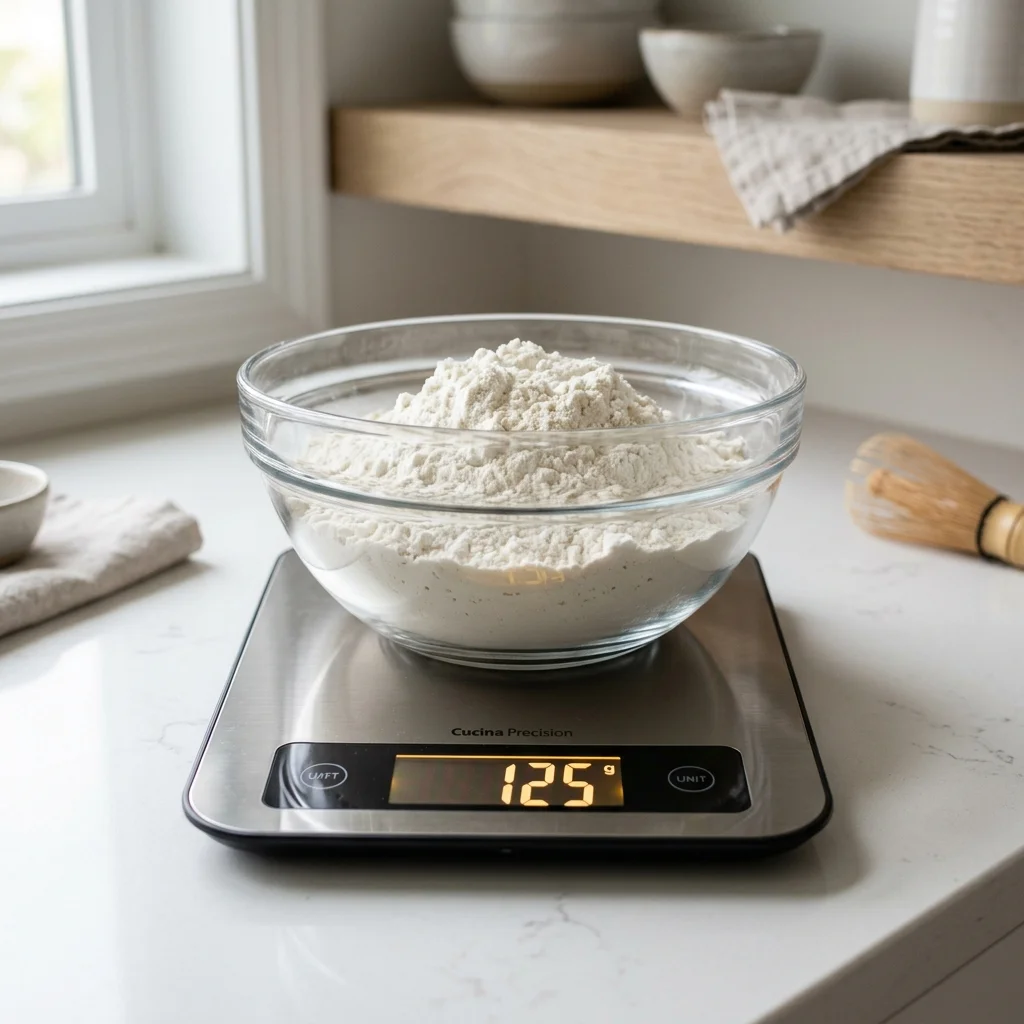
For instance, a FoodData Central record for enriched all-purpose flour might state that 1 cup of unsifted, spooned flour weighs 125 grams, while another record representing sifted flour lists 1 cup as 115 grams. The database does not declare one number as an absolute universal law; rather, it documents the precise physical state and measured weight of the sample analyzed during data collection.
Bakers can extract these portion-to-weight associations to establish reliable baseline weights, provided they carefully verify the preparation state recorded in the USDA sample entry.
What Is Food Density?
In physical science, density is defined as the ratio of mass to volume:
In culinary science, ingredient density dictates how many grams of a given food fit into a 1-cup (236.588 ml) volumetric container. Different ingredients exhibit wildly different densities based on their molecular structure, fat content, moisture levels, and aeration:
- Water Baseline: Pure liquid water has a density of exactly 1.00 g/ml, meaning 1 US cup of water weighs 236.6 grams.
- Granulated Sugar: Dense sucrose crystals pack tightly together, yielding a density of ~0.85 g/ml (~200 grams per cup).
- All-Purpose Flour: Particulate wheat flour contains significant trapped air spaces, yielding a variable density between 0.48 g/ml and 0.60 g/ml (~120g to 140g per cup depending on packing).
- Vegetable Oil: Lipids are less dense than water (~0.92 g/ml), weighing approx. 218 grams per cup.
- Honey: A supersaturated sugar syrup with low moisture content (~1.42 g/ml), weighing approx. 336 grams per cup.
Why FoodData Central Is Useful for Baking Research
For culinary researchers, nutritionists, and professional bakers, FoodData Central provides an invaluable reference point for ingredient standardization. Incorporating USDA data into baking research delivers key advantages:
Data Verification
Cross-referencing commercial baking charts against USDA laboratory records eliminates egregious errors or typos in informal recipes.
Ingredient Standardization
Provides consistent baseline values when converting vintage or unweighted recipes into modern metric mass units.
Nutritional Accuracy
Ensures accurate macronutrient and caloric calculations based on verified mass measurements rather than estimated volume.
Commercial Quality Control
Helps bakeries and food manufacturers establish reliable yield formulations and nutrition labeling specifications.
FoodData Central Data Types
To use USDA FoodData Central effectively, bakers must understand its distinct dataset classifications. The platform organizes food records across five principal categories:
- Foundation Foods: Modern, highly detailed records derived from extensive laboratory sampling. Foundation Foods provide comprehensive nutrient profiles, statistical variability, and exact sample processing notes. This is the most valuable dataset for ingredient density research.
- Branded Foods: Data submitted directly by commercial food manufacturers and brand owners. These records reflect specific package labeling and serving sizes rather than independent USDA laboratory testing.
- Standard Reference Legacy (SR Legacy): The historical baseline database (discontinued in 2018 but still accessible). Contains values for thousands of generic commodities (e.g., "Flour, wheat, all-purpose, enriched").
- Food and Nutrient Database for Dietary Studies (FNDDS): Used primarily to analyze national dietary survey data, converting survey responses into food and nutrient values.
- Experimental Foods: Research datasets focused on agricultural variables, genetics, and processing methods.
Foundation Foods
Foundation Foods represents the current gold standard in USDA food composition research. Introduced to replace static legacy tables, Foundation Foods records capture metadata on sample origin, agricultural cultivar, harvesting location, analytical method, and inherent variance.
For baking scientists, Foundation Foods is essential because it details how physical factors (such as flour moisture percentage or sugar grain size) influence sample mass. Rather than offering a single unyielding number, Foundation Foods illustrates the realistic range of density variations across natural agricultural products.
Branded Foods
The Branded Foods database is a public-private partnership between the USDA and the Agricultural Food Products Database Partnership. It contains hundreds of thousands of commercial branded food products.
While Branded Foods offers immense utility for tracking commercial items, bakers should treat its gram weights with caution. Serving sizes on branded packaging are frequently rounded to comply with FDA nutrition labeling regulations (for example, rounding 28.35g to 28g or 14.18g to 14g). For scientific recipe scaling, Foundation Foods or direct laboratory measurement provides superior accuracy over consumer box labels.
Why FoodData Central Values May Differ From Baking Charts
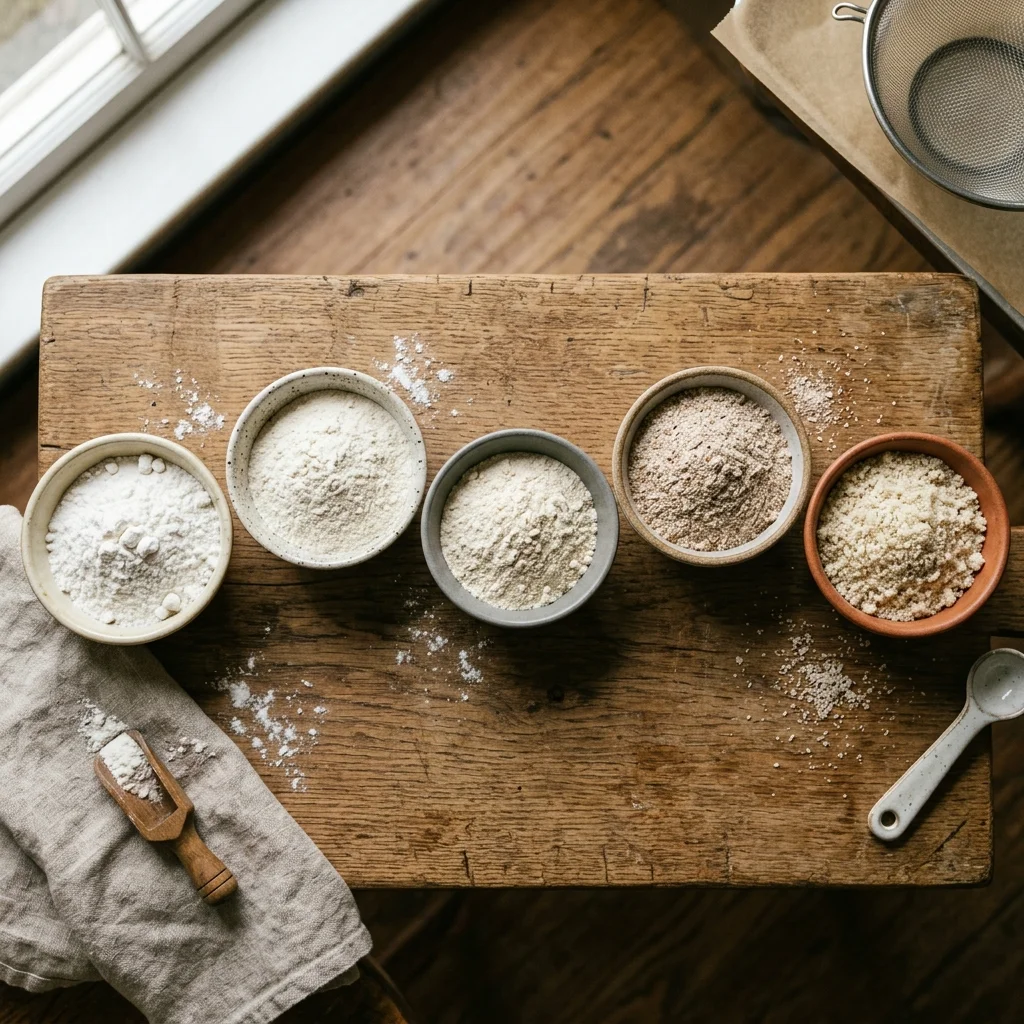
Home bakers often ask why a USDA record might list 1 cup of flour at 125g, while a popular baking publication lists 120g, and a European conversion chart states 140g. These discrepancies are not necessarily mistakes, they stem from fundamental differences in measurement methodology:
- Sampling Technique: USDA laboratory protocol typically uses a standardized "spoon-and-level" or specific volumetric funnel displacement method. Informal recipe charts may rely on direct cup scooping (which packs flour tightly to 140g+).
- Preparation and Aeration: Sifted flour contains far more air than settled flour stored in a container for months.
- Moisture Content & Humidity: Flour absorbs ambient environmental humidity. High humidity increases grain mass without increasing volume, altering bulk density.
- Regulatory Rounding: Commercial serving size charts round gram weights to the nearest whole integer or 5g increment.
- Ingredient Subtype Variations: Unbleached hard red spring wheat flour has a slightly different bulk density than bleached soft winter wheat flour.
Can You Use USDA Data for Cups-to-Grams Conversion?
Yes, provided you follow a structured, step-by-step workflow to ensure accuracy. For a comprehensive reference of standardized culinary gram weights, consult The Master Cups to Grams Baking Conversion Guide.
Recommended USDA Conversion Workflow:
- Identify the Exact Ingredient: Search for the specific commodity in FoodData Central (e.g., "Wheat flour, white, all-purpose, unenriched").
- Verify the Preparation State: Check whether the entry specifies raw, sifted, spooned, or packed state.
- Locate Household Measures: Navigate to the "Portions and Measures" tab and locate the 1-cup or 1-tablespoon record.
- Extract the Recorded Gram Mass: Note the precise gram weight associated with that portion.
- Calculate Density / Conversion Ratio: Divide the gram mass by the volume (236.588 ml per US cup) to calculate density in g/ml if needed.
- Cross-Reference with Recipe Context: Compare the USDA baseline against your specific recipe author's stated measurement convention (e.g., King Arthur vs. Julia Child standards).
Example: Building an Ingredient Conversion Record
The table below demonstrates how to construct a scientifically transparent conversion record by extracting sample data from official USDA FoodData Central entries:
| Ingredient Name | USDA FDC ID | Household Measure | USDA Gram Weight | Calculated Grams / Cup | Preparation & Notes |
|---|---|---|---|---|---|
| All-Purpose Wheat Flour | 168936 (SR Legacy) | 1 cup, unsifted | 125 g | 125.0 g / cup | Spooned and leveled standard sample |
| Granulated White Sugar | 169655 (SR Legacy) | 1 cup | 200 g | 200.0 g / cup | Refined sucrose crystals, dry |
| Light Brown Sugar | 168833 (SR Legacy) | 1 cup, packed | 220 g | 220.0 g / cup | Firmly packed in cup measure |
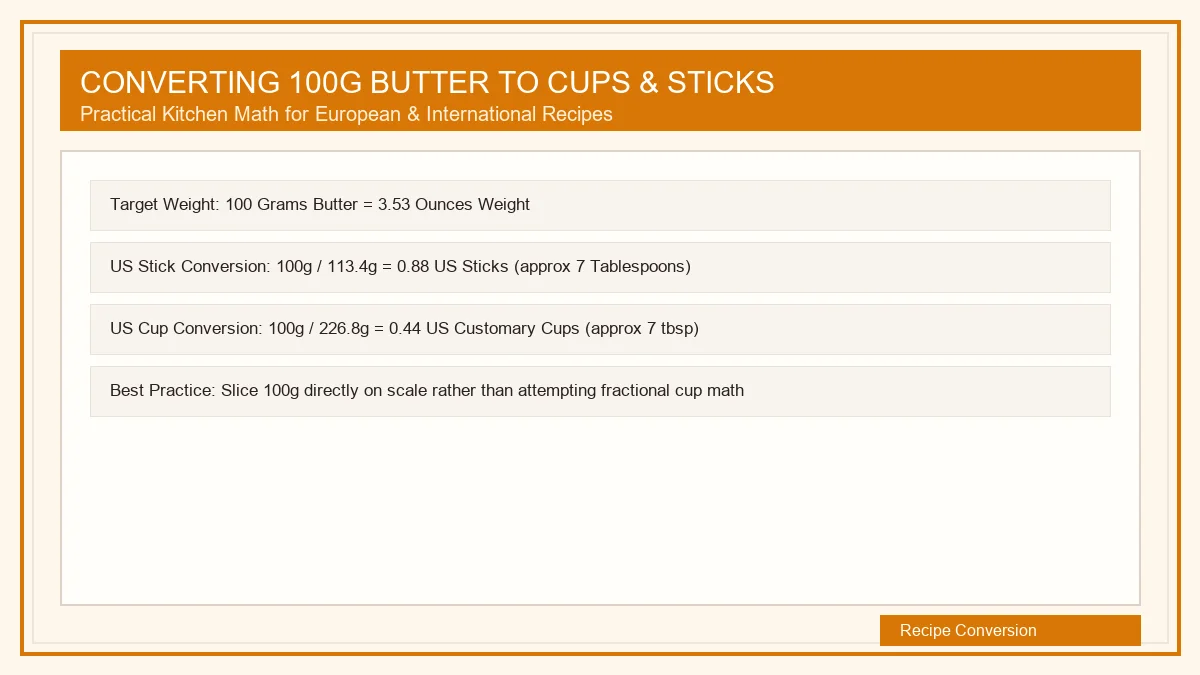
| Unsalted Butter | 173410 (SR Legacy) | 1 cup (2 sticks) | 227 g | 227.0 g / cup | Standard US butter stick (8 oz mass) |
| Pure Honey | 169640 (SR Legacy) | 1 cup | 336 g | 336.0 g / cup | Liquid liquid sweetener (~1.42 g/ml) |
| Vegetable Oil (Canola) | 172336 (SR Legacy) | 1 cup | 218 g | 218.0 g / cup | 100% lipid liquid (~0.92 g/ml) |

Why Flour Conversion Is More Complicated
Flour is the single most variable ingredient in baking. Because flour consists of tiny starch particles and proteins interspersed with air pockets, its volume changes dramatically depending on handling technique.
Consider the differences in bulk density across preparation states:
- Sifted Flour: Aerated particles yield ~110g to 115g per cup.
- Spooned and Leveled Flour: Lightly fluffed and spooned yields 120g to 125g per cup (the standard recommendation used in How to Measure Flour Correctly).
- Dip-and-Sweep (Scooped): Dipping a measuring cup directly into a dense bag packs the flour to 140g or more per cup, a 16% excess error that ruins cake texture.
Furthermore, flour species alter density. For comparisons between grain types, read our specialized guides on Almond Flour vs All-Purpose Flour and Gluten-Free Flour Blends.
Why Sugar Conversion Differs
Sugar crystals behave differently from flour. Granulated white sugar consists of hard sucrose crystals that do not compress significantly under pressure. Therefore, 1 cup of granulated sugar consistently weighs 200 grams regardless of whether it is spooned or scooped.
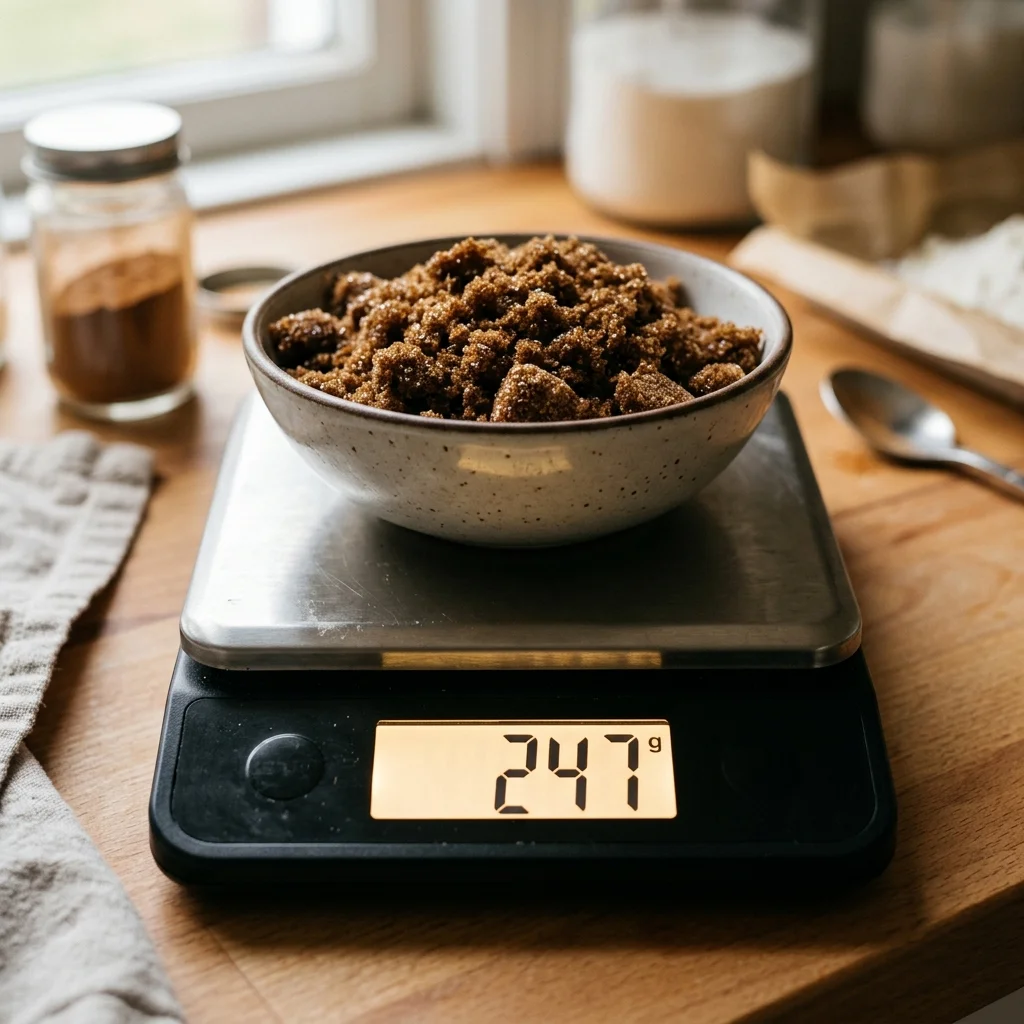
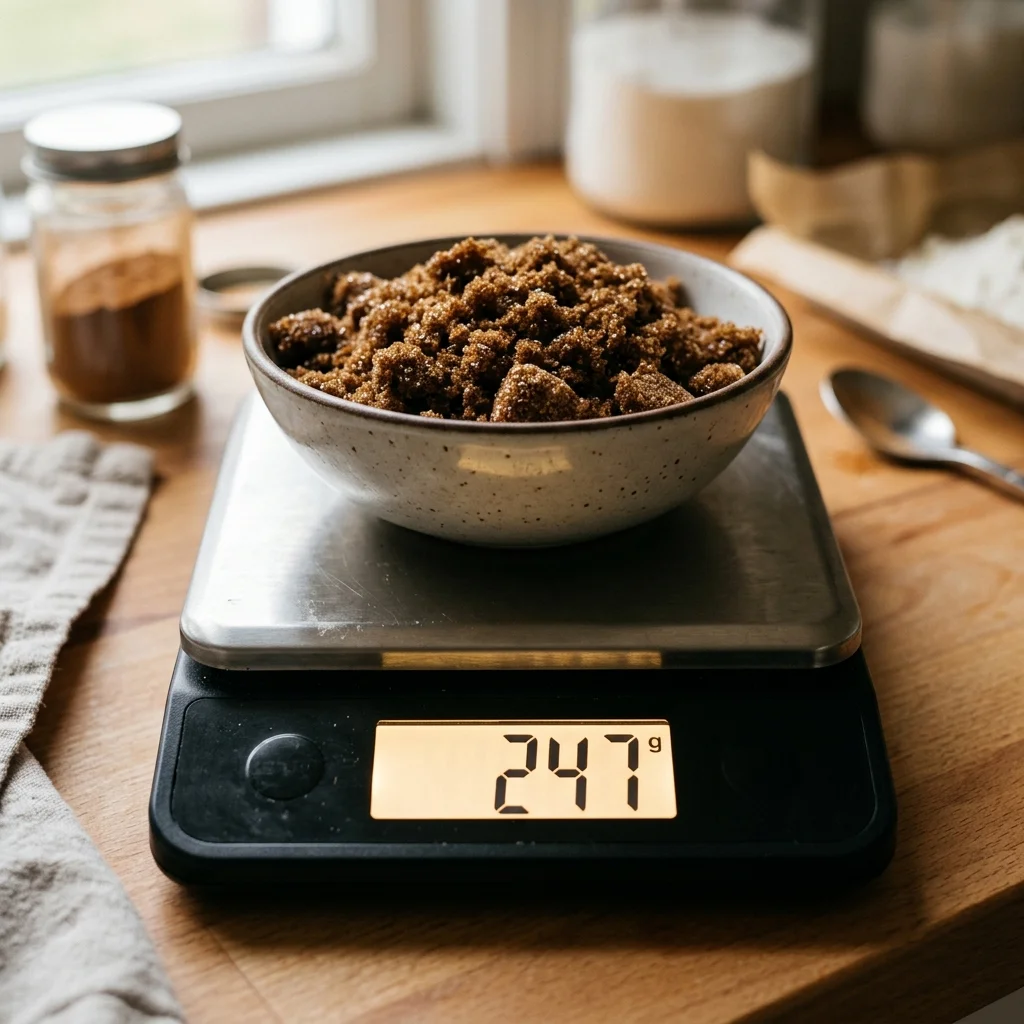
Conversely, powdered sugar (confectioners' sugar) contains fine sucrose dust mixed with cornstarch, making it highly compressible (sifted = 100g/cup; unsifted = 120g/cup). Light and dark brown sugars contain added molasses film that causes crystals to stick together, requiring firm packing (packed = 220g/cup; loose = 180g/cup). Explore detailed weight benchmarks in our full Sugar Conversion Guide.
Why Liquids and Oils Behave Differently
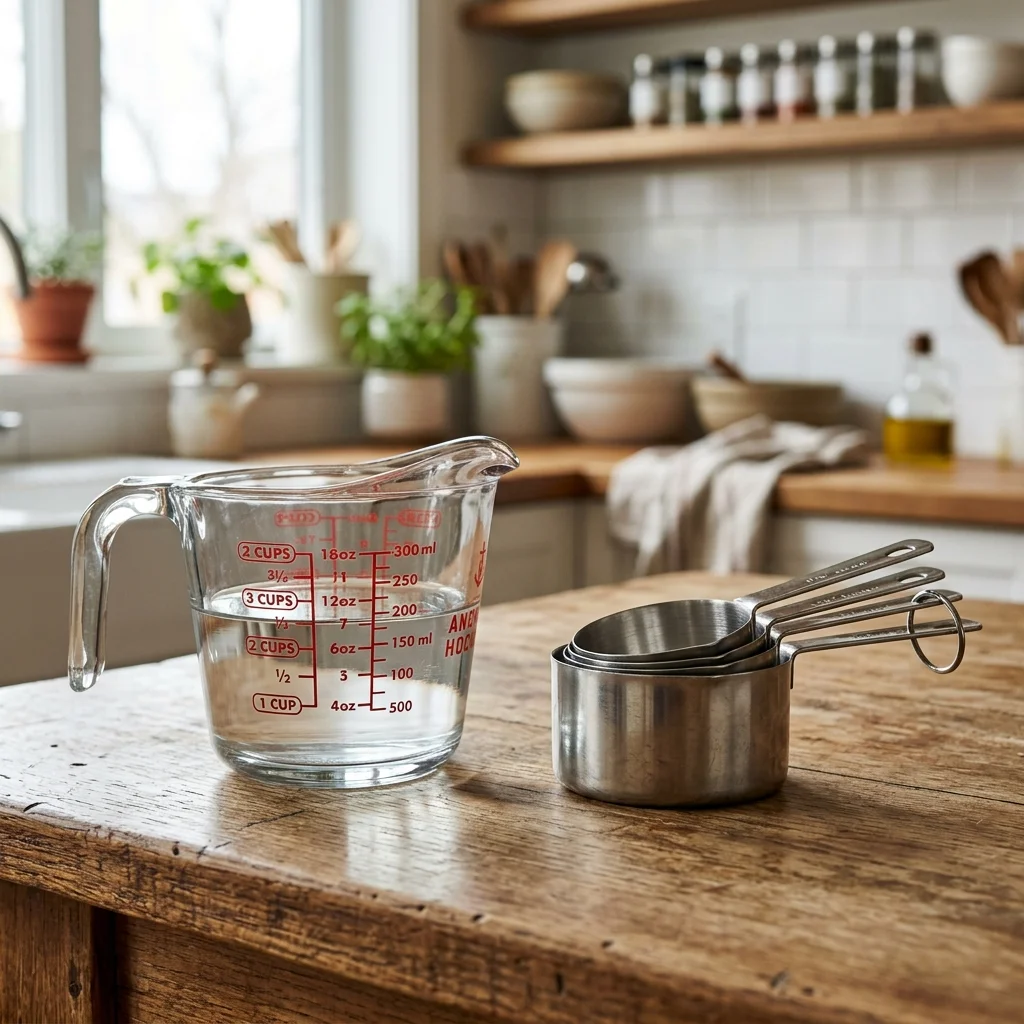
When measuring liquid ingredients, bakers often confuse fluid ounces (volumetric space) with weight ounces (gravimetric mass). Water-based liquids like whole milk and skim milk have densities very close to 1.00 g/ml (1 US cup = 240g or 8.45 oz weight).
However, cooking oils (canola, olive, coconut oil) are hydrophobic lipids with lower molecular density (~0.92 g/ml), so 1 US cup of oil weighs only 218 grams (7.7 oz weight). Viscous liquid sweeteners like honey and molasses are intensely dense (~1.42 g/ml), weighing 336 grams per cup. For techniques on measuring sticky ingredients accurately without mess, consult How to Measure Sticky Liquids.
USDA Data vs Recipe-Specific Weight Charts
To choose the right reference source for your baking needs, compare how USDA FoodData Central measures up against alternative kitchen reference data:
| Source Type | Best Use Case | Primary Strength | Key Limitation |
|---|---|---|---|
| USDA FoodData Central | Nutritional analysis, food science research, general commodity benchmarks | High scientific rigor, peer-reviewed laboratory methods, transparent metadata | Not designed specifically as a baking recipe instruction guide |
| Baking Weight Charts (e.g. King Arthur) | Home and professional baking, recipe development, flour scaling | Tailored specifically to practical culinary techniques and commercial ingredient brands | May vary slightly between different culinary test kitchens |
| Recipe Author Stated Grams | Executing a specific author's cookbook or blog recipe | Matches the exact test kitchen conditions under which the recipe was developed | Only applies to that specific author's recipes |
| Manufacturer Package Labels | Commercial product portioning and dietary tracking | Reflects exact brand formulation on the shelf | Subject to FDA consumer serving size rounding rules |
| Direct Digital Scale Measurement | Actual day-to-day kitchen execution | Measures the exact physical mass in real time, eliminating all volumetric error | Requires owning and using a digital scale |
Can USDA FoodData Central Replace a Kitchen Scale?
No. A database provides reference information; a digital scale measures the physical reality in your kitchen.
No matter how precise a database entry is, it cannot account for how tightly you scoop flour, the ambient humidity in your kitchen, or subtle brand variations in butter moisture. Relying on database averages while measuring with volumetric cups still introduces human error. The ultimate baking precision comes from using a Step-by-Step Digital Kitchen Scale and learning Why Baking by Weight Is Superior to Measuring by Volume.
How to Use FoodData Central Without Creating False Precision
High E-E-A-T (Experience, Expertise, Authoritativeness, and Trustworthiness) standards demand scientific honesty. When referencing USDA food data, avoid claiming false precision.
Editorial Principles for Using Food Data:
- Avoid Absolute Claims: Never state "The USDA mandates that 1 cup of flour equals exactly 125.000 grams for all recipes."
- Use Qualifying Terminology: Use phrases such as "According to USDA FoodData Central record #168936," "based on standard spooned household measures," or "yields an approximate density of."
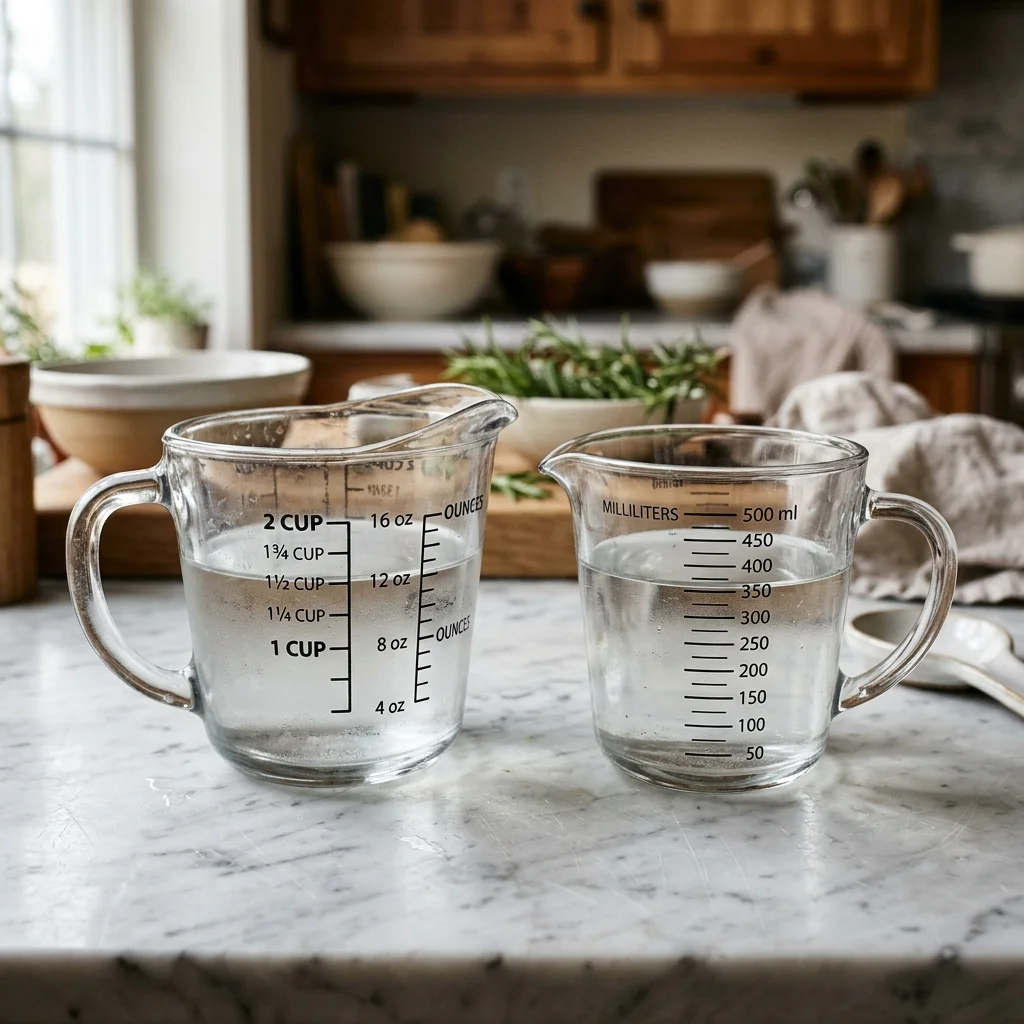
- Contextualize International Units: Note differences when converting between US Customary cups (236.588 ml), Metric cups (250 ml), and Imperial cups (284.13 ml), as detailed in our guide on US Cup vs Metric Cup vs Imperial Cup.
- Acknowledge Natural Variance: Explain that agricultural commodities naturally fluctuate in density based on crop year and processing.
Common Ingredient-Density Mistakes
Avoid these frequent mistakes when researching ingredient weights:
- Treating Density as Universal: Assuming all flours (all-purpose, bread, cake, almond, coconut) share the exact same weight per cup.
- Using One Ingredient's Weight for Another: Expecting 1 cup of sugar (200g) to weigh the same as 1 cup of flour (120g).
- Ignoring Preparation State: Confusing sifted flour weights (115g) with packed flour weights (140g+).
- Confusing Volume and Mass: Believing 8 fluid ounces of honey equals 8 weight ounces (8 fl oz of honey actually weighs 11.8 oz!).
- Treating Food Database Values as Recipe Instructions: Overriding a recipe author's explicit gram weight with a generic database average.
- Excessive Rounding Errors: Rounding scaling factors prematurely during multi-step batch conversions, as warned in Top 7 Gram-to-Cup Conversion Mistakes.
- Confusing US and Metric Cup Standards: Applying US USDA cup weights (236.6 ml) to Australian or International recipes (250 ml cups).
Sources & Methodology
The ingredient data, density calculations, and portion weights cited in this guide are derived from published government databases, scientific peer-reviewed literature, and empirical culinary laboratory tests:
Primary Data Sources:
- USDA Agricultural Research Service (ARS): FoodData Central Database (fdc.nal.usda.gov). Foundation Foods & Standard Reference Legacy Datasets.
- U.S. Food and Drug Administration (FDA): Code of Federal Regulations Title 21 (21 CFR 101.9) Reference Amounts Customarily Consumed (RACC).
- King Arthur Baking Company: Ingredient Weight Chart & Test Kitchen Density Benchmarks.
- Grams to Cups Empirical Culinary Lab: Gravimetric mass measurements using Class II calibrated digital scales at 20°C (68°F).
Data Classification Legend:
- SOURCE DATA: Unmodified gram weights extracted directly from USDA laboratory records.
- CALCULATED VALUE: Mass-to-volume density derived via ρ = m / V.
- APPROXIMATION: Standardized practical kitchen averages rounded to whole grams for home baker utility.
FAQs
1. What is USDA FoodData Central?
USDA FoodData Central is the official public food composition database managed by the USDA Agricultural Research Service, providing detailed scientific records of nutrient profiles, food measures, and portion weights.
2. Does USDA FoodData Central show grams per cup?
Yes. In individual food records under the "Portions and Measures" tab, FoodData Central associates specific household measures (such as 1 cup or 1 tablespoon) with verified gram weights.
3. Can FoodData Central convert cups to grams?
FoodData Central provides portion weight reference data that allows you to calculate cups-to-grams conversions for specific food items, though it is not an automated interactive conversion calculator.
4. Does USDA provide food density data?
FoodData Central records mass (grams) for specific volumetric portions (cups/tablespoons). Dividing recorded gram mass by the portion volume yields the ingredient's physical density.
5. What is Foundation Foods?
Foundation Foods is USDA's modern food dataset containing extensive laboratory sampling data, statistical variance, and detailed metadata regarding agricultural origin and processing methods.
6. What are Branded Foods?
Branded Foods is a dataset within FoodData Central containing data submitted directly by commercial food manufacturers, reflecting commercial packaging and nutrition label serving sizes.
7. Are USDA food weights exact?
USDA food weights reflect precise laboratory measurements of specific samples, but natural agricultural products inherent variability means actual home ingredient weights will vary slightly.
8. Why do food conversion charts disagree?
Conversion charts disagree due to differences in volumetric cup standards (US vs. Metric), sampling technique (spoon-and-level vs. dipping), aeration, moisture content, and brand formulations.
9. Can USDA data be used for baking?
Yes, USDA portion weights provide an excellent scientific baseline for converting recipes to gram weights, provided you account for the ingredient's preparation state.
10. Is FoodData Central a recipe database?
No. FoodData Central is a scientific food composition and nutrient database, not a culinary recipe collection.
11. Can FoodData Central replace a kitchen scale?
No. A database offers reference estimates, but only a digital kitchen scale measures the exact physical weight of ingredients in your specific kitchen in real time.
12. How do I calculate ingredient density?
Calculate density by dividing an ingredient's mass in grams by its volume in milliliters (Density = g / ml). For US cups, divide gram mass by 236.588 ml.
13. Why does flour have different gram weights?
Flour weight varies based on packing technique (sifted = ~115g, spooned = ~125g, scooped = ~140g+), humidity absorption, protein content, and grain species.
14. How do household measures relate to grams?
Household measures (cups, tablespoons) define volumetric space, while grams measure gravimetric mass. The relationship between the two is determined by the ingredient's density.
For specific ingredient application guides, refer to our detailed articles on master cups to grams baking conversion guide, how to measure flour correctly, sugar weight conversion guide, almond flour vs all-purpose flour weight ratios, and measuring sticky liquids like honey and molasses.
Interactive Baking Weight Converter
Convert recipe volumes into exact gram weights instantly.
Interactive Baking Weight Converter
Convert recipe volumes into exact gram weights instantly.
Custom package weights override standard database densities for this session without altering official database records.
Need Full Density Reference Tables?
Explore complete g/cup density tables, USDA ratios, and measurement tools.
Related Baking Guides
US Cup vs Metric Cup vs Imperial Cup: The International Baking Guide
Learn the difference between US, metric, and Imperial cups, their milliliter sizes, and how to convert international baking recipes accurately.
Baking ScienceWhy Baking by Weight Is Superior to Measuring by Volume
Learn why weighing baking ingredients in grams is more accurate than cups, how density affects volume, and how a kitchen scale improves consistency.
Baking ScienceHow to Bake European Recipes in an American Kitchen
Learn how to convert European baking recipes for an American kitchen, including grams, milliliters, Celsius, gas marks, cups, and ingredient weights.